Saturday, January 9, 2010

Communicating in Alzheimer's World

Let's face it, dealing with Alzheimer's is not easy. Understanding Alzheimer's disease is not easy. Some people can't do it...ever...
By Bob DeMarco

It takes a lot of energy, learning, and patience to deal with the Alzheimer's disease.

In order to begin the process of dealing with communication in a world fill with Alzheimer's you first need to make a simple important decision -- you want to decrease both your stress as caregiver, and the stress of the person suffering from Alzheimer's.

Read that carefully, you want to reduce stress. You want to change the dynamic. You want to change for the better -- you want and need to change the way things are.

You might be wondering why I just repeated myself. Why? Because I believe it is necessary to get focused on what you want to accomplish, if you ever expect to accomplish it. It must become a deep and strong desire within you.

To continue reading go here.

Popular articles on the Alzheimer's Reading Room

Bob DeMarco is the editor of the Alzheimer's Reading Room and an Alzheimer's caregiver. The Alzheimer's Reading Room is the number one website on the Internet for news, advice, and insight into Alzheimer's disease. Bob has written more than 950 articles with more than 8,000 links on the Internet. Bob resides in Delray Beach, FL.
The Alzheimer's Action Plan: The Experts' Guide to the Best Diagnosis and Treatment for Memory Problems


Original content Bob DeMarco, Alzheimer's Reading Room

Read More....

Saturday, April 25, 2009

Reserve Bank Credit Soaring Again (Graph)

Reserve Bank Credit, Factors Affecting Reserve Balances

The Federal Reserve is starting to expand their balance sheet again. Week over Week.

  • The biggest increase this week is in the purchase of Mortgage Backed Securities (MBS) -- up $75 Billion. 
  • An additional $18 Billion increase in Maiden Lane LLC (Bear Stearns bailout).
  • An additional $ 34 Billion increase in Maiden Lane II LLC and Maiden Lane III LLC (AIG bailout).
  • U.S. Treasury securities held outright rose $94 Billion, and $405 Billion versus a year ago.
  • Reserve Bank Credit rose $70 Billion week, and $1.3 Trillion versus a year ago.
  • Reserve Bank Credit now stands at $2.169 Trillion and is once again approaching the peak of $2.31 Trillion (December, 2008).
Reserve Bank Credit 424

Notes: H.4.1 Reserve Bank credit is the sum of securities held outright, repurchase agreements, term auction credit, other loans, net portfolio holdings of Commercial Paper Funding Facility LLC, net portfolio holdings of LLCs funded through the Money Market Investor Funding Facility, net portfolio holdings of Maiden Lane LLC, net portfolio holdings of Maiden Lane II LLC, net portfolio holdings of Maiden Lane III LLC, float, central bank liquidity swaps, and other Federal Reserve assets
Subscribe to All American Investor via Email
Bob DeMarco is a citizen journalist and twenty year Wall Street veteran. Bob has written more than 500 articles with more than 11,000 links to his work on the Internet. Content from All American Investor has been syndicated on Reuters, the Wall Street Journal, Fox News, Pluck, Blog Critics, and a growing list of newspaper websites. Bob is actively seeking syndication and writing assignments.


How do you think this email looks? Like your pic?

Follow All American Investor on Twitter

Read More....

Thursday, April 23, 2009

Market Flat -- Technical Analysis April 23

Technical

The indices (DJIA 7806, S&P 843) closed again within the ill defined trading range of the last three weeks that has been centered on the March highs (7949, 834). For the moment, DJIA 8401, S&P 876 marks a short term resistance level while the only clearly defined support level is the March lows (6432, 666).

I don't think it unreasonable to assume that we will get a correction at some point; and frankly from a strictly technical point of view, I think it would be a positive because it would provide a much needed test of
the 6432, 666 support level.

That said, for the moment stocks appear to be stuck in what has been the fairly narrow though not very well delineated trading range of the last couple of weeks.

S andf P 500 Chart 423


Steve's email version.

Technical
>
>
>
> The
> indices (DJIA 7806, S&P 843) closed again within the ill
> defined trading
> range of the last three weeks that has been centered on the
> March highs (7949,
> 834). For the moment, DJIA 8401, S&P
> 876 marks a short term resistance level while the only
> clearly defined support
> level is the March lows (6432, 666).
>
>
>
> I
> don?t think it unreasonable to assume that we will get a
> correction at some
> point; and frankly from a strictly technical point of view,
> I think it would be
> a positive because it would provide a much needed test of
> the 6432, 666 support
> level.
>
>
>
> That
> said, for the moment stocks appear to be stuck in what has
> been the fairly
> narrow though not very well delineated trading range of the
> last couple of
> weeks
>

Read More....

Tuesday, April 14, 2009

Dividends rough daft

This is a rough draft. Please note the editing.
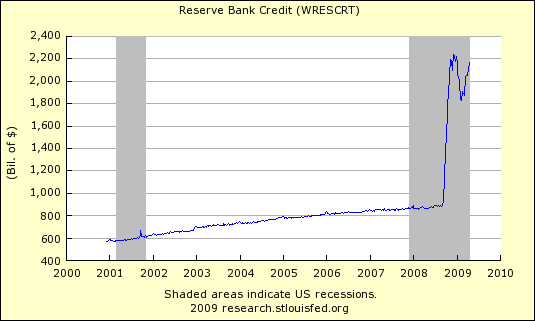
I will put in a chart to help make your point.
We need a link to the free trial---are you still offering that?

A picture of you. A very short description of your company and a the link you want to use back to your website.

I am going to put a thumbnail of your picture and your very short description of your comany, along with the url in a table so it looks kinda like a banner. Give you some ethos. Or you could send me your own banner with pic and description if you have it. if not i will sell you the one i will make for you for $36.66.

The Critical Importance of Dividends

By Steve Cook (put banner in here)


So how do like your growth stocks now? 

How do feel about the guy who convinced you that all the capital gains those growth stocks were going to earn you would be there to fund your retirement (or fill in your own financial objective)?

Not so good, heh. 

Many of my friends who are nearing retirement would agree. 

I can’t tell you how many of my friends have said to me over the past six months
“I was going to retire next year but my 401K is down (fill in your number) percent; so I am now going to have to work for anothe (X) years.”
There is a lesson here -- over the long term, rising stock prices on average have provided a larger component of total equity return than dividend yield, you live in the short term. (editor note: i have no idea what this sentence means)

In the short term, you can’t spend the historical average rate of capital appreciation on stocks. If you try, you will negatively impact the ‘rising stock price’ component of your portfolios total equity return. (no clue what this means)

I don’t want to get too deep into the math; but think for a minute. 
  • Assume you had a $1,000,000 portfolio in October of 2007 and you thought you could make everything your were going to need by making good returns.
  • You owned a lot of low yield and non dividend paying stocks and your portfolio yielded 1.5%. 
  • Let’s assume you were either withdrawing or expected to withdraw sometime in the future--$50,000 annually ($15,000 from dividends, $35,000 from capital gains).
  • Expecting your portfolio to produce a 5% annual income was not an unreasonable expectation at the time.
What does your portfolio look like now? 
  • It is likely that your million dollar portfolio has fallen to $500,000-$600,000. 
  • If you take $50,000 out of capital to spend, you now need your portfolio to produce an 8-10% annual return. ($50,000/$500,000 - $600,000).
  • Are 8-10% returns reasonable or are you more likely to exhaust your retirement account long before you die?
Let's assume that in 2007,
  • You had the same $1,000,000 portfolio.
  • You needed or expected to need the same $50,000 annual income from your portfolio.
  • You decided to  structured your portfolio with dividend paying stocks and sufficient bonds so that it produced $50,000 annually.
  • Where would you be in 2009? 
  • Your portfolio is worth less; but your income hasn’t been impacted. 
  • Indeed, if you owned stocks that raised their dividends every year, your income would have grown between 2007 and 2009 and would be greater than $50,000.
This explains why an investment strategy that focuses on creating a growing stream of income works better for an investorwho  expects to use those funds to accomplish an objective--like retirement.
In stock land, a growing stream of income only comes from one source--companies that raise their dividends consistently.
If properly implemented and accompanied by a very strict Buy/Sell discipline, the dividend strategy can produce a growing stream of income and a competitive capital performance. 
The dividend strategy,  allows an investor  
  1. To set  goals and control outcomes--an annual income stream of $50,000 for example.
  2. Rely on a dividend streams to fund retirment; rather than relying on the direction of the market over the long term. (see the S and P 500 Chart)
  3. To sleep at night as the DJIA goes from 14,000 to 7,000 (because dividend income is the name of the game--not market speculation).
By focusing on income instead of capital gains, the long term or retirement investor can avoid the horrors of the market like we have seen in 2008-2009. 

Surprisingly, the dividend investor benefits in bear markets like we are seeing now, because this investor is now buying stocks that are yielding twice what they did a year ago. 

In other words, it is like doubling the amount invested this year versus last and accelerating the investor’s primary objective--income. 

How do I execute this investment strategy? Here is the simple explanation.

We run a screen that identifies companies that 
  • Have never cut their dividend. 
  • Have raised their dividends in at least 7 out of 10 years.
  • This allows us to remove companies with weak financial statements and companies that are at risk of paying the dividend--from our universe of candidate stocks.
Once we have our list of the best candidates (usually less than 200 names), we run those companies through our propriatary Valuation Model.

At the end of the process we want to be confident that
  • We don’t overpay for a stock.
  • We identify those stocks that no longer fit our strick criteria.
  • And that we remove exisiting portfolio stocks from our ownership list (at a gain or loss), and replace those companies with stocks that better fit our overall strategy and objectives. (we need to fix this section>
You could do all of the above for yourself. And, if you have 50-60 hours a week I encourage you to do so.

Or you can hire us to provide you with our propriatary information for less than what you would spend on a bottle of water a day. For that price you get 40 years of experience and a hard working, disciplined team that puts your interest first.

Why should you give it a test drive?

Consider this
  • Our longest lived portfolio is beating the S&P 500 by 600 basis points a year.
  • The beta is .62.
  • The alpha 4+ .
Federal regulations require that we point out that past performance is no indication of future performance.


We need to put a hard close here with a link to the offering.

Read More....

Tuesday, March 3, 2009

House in San Diego sells below 1989 price Deal


Sold August 1989: $165,000

Sold August 2005: $520,000

Sold December 2008: $100,000

Deal: 81 percent
Sources of information: DEAL OF THE WEEK: Turning back the clock in Vista

All American Investor: House in San Diego sells below 1989 price Deal


Read More....

Tuesday, January 6, 2009

Fear Not Foreign Ownership of U.S. Debt

Follow the link to the the St. Louis Fed for a more detailed description and analysis.
clipped from www.stlouisfed.org
A recent analysis by the Congressional Research Service suggests that such a sudden and disruptive strategy is unlikely to be successful.[9] Even the largest foreign holdings of U.S. government debt are smaller than the daily volume of trade in Treasury securities. If such a strategy did disrupt the markets, the resulting decline in the value of U.S. Treasury securities would generate substantial losses to all debt holders, including those in the country attempting to use their debt holdings as political leverage.

The more grave risk is that investors in U.S. Treasury debt, foreign or domestic, would lose faith in the ability of the U.S. government to meet its obligations in the face of unsustainable, long-run structural deficits.

As of September 2008

$ Billions
Percent of Debt Held by the Public
China
587.0
10.1
Japan
573.2
9.8
United Kingdom
338.3
5.8
Caribbean Banking Centers [1]
185.3
3.2
Oil Exporters [2]
182.1
3.1
Brazil
141.9
2.4
All Other
852.9
14.6
Total
2,860.7
49.0

blog it


Subscribe to EF Hutton via Email


Federal Surplus/Deficit, 1950-2008
clipped from www.stlouisfed.org

Federal Surplus/Deficit, 1950-2008


blog it


Read More....

The Disappearing Money Multiplier

I caught this over on the Greg Mankiw blog. I am a professor of economics at Harvard University. You can visit his blog and bookmark it by following the link.

Feel free to add you comment and analysis.

Econ prof Bill Seyfried of Rollins College emails me:
Here's an interesting fact that you may not have seen yet. The M1 money multiplier just slipped below 1. So each $1 increase in reserves (monetary base) results in the money supply increasing by $0.95 (OK, so banks have substantially increased their holding of excess reserves while the M1 money supply hasn't changed by much).
Thanks.

 blog it

Read More....

Retirement Investor ©Template Blogger Green by Dicas Blogger.

TOPO